network analyzer 150MHz
Network analyzer 150MHz
We built this (150MHz) network analyzer to extend the frequency range and the dynamic range of our (60MHz) network analyzer.
The frequency range of this network analyzer is from 1000Hz to 150MHz. With a slow scanning rate, it is possible to measure between 20Hz and 150MHz.
Compared with the 60MHz analyzer, the main changes are:
– The AD9951 replaces the AD9851 (as Direct Digital Synthesizer)
– the LTC2440 replaces the ADS1251 (as analog to digital converter)
The LTC2440 is used on the N2PK network analyzer.
Our network analyzer uses several ideas coming from the N2PK network analyzer.
The description of this 150MHz analyzer is nearly a copy/paste of our 60MHz analyzer.

When we want to build some electronic circuits, the first measuring device that we need is a voltmeter.
Then, very quickly, we need an oscilloscope (to see why our circuit does not work).
Very often, we need to measure the behavior of some components at different frequencies : resistors, capacitors, inductances, filters, crystal quartz … etc ; or we need to study the stability of a control loop.
One of the best way to do these measurements is to use a network analyzer. Commercial network analyzers are very sophisticated, very powerful, but also very expensive.
So, we tried to build a small network analyzer.
The network analyzer we will describe here, is mainly a sine wave generator driven by a personal computer (PC) and a voltmeter connected to the same PC. The voltmeter is like a synchronous detector, it measures the amplitude and the phase of the signal at the frequency of the generator. The frequency range is from 1000Hz to 150MHz, the frequency resolution is approximately 0.093 Hz. With a slow scanning rate, it is possible to measure from 20 Hz .
The network analyzer measures the gain and the phase (or the group delay) of filters and amplifiers (versus frequency). The gain scale is linear or logarithmic (dB scale) ; the frequency sweep is linear or logarithmic.
The network analyzer measures impedances , it can display :
– the module and the argument (phase) of the impedance .
– the real part and the imaginary part of the impedance.
– the module and the phase of « S11 »
– for a capacitor, the capacitance of the capacitor and the quality factor (Q)
– for an inductor, the inductance of the inductor and the quality factor (Q)
The PC drives the network analyzer with an USB port.
On this site, you can find the description and the electrical schematics of this analyzer.
The programs to run this analyzer are also available (for linux and windows).
Here are some measurements :
 Impedance measurement of a 32768 Hz quartz crystal.
Here is the curve showing the series resonance and the parallel resonance of a quartz crystal for watches.
(The scale for the impedance is log, the scale for the phase is linear)
To do this measurement, it is necessary to be careful.
Near the series resonance, if we drive the crystal quartz with too much power, we can break the crystal.
At the series resonance, the power dissipated in the crystal is : P=U*U/R
U is the voltage applied to the crystal, R is the impedance of the crystal at the series resonance. Manufacturing recommend not to exceed one microwatt.
In the vicinity of series resonance , the speed of the scanning must be very slow to allow the stabilization of the quartz crystal after each change of frequency.
In the vicinity of parallel resonance, the impedance becomes very large, up to 838M?. Set the generator at 8dBm, and use a slow scanning speed to reduce the noise on the measurement.
the frequency of the series resonance is fs=32764.06Hz
the frequency of the parallel resonance is fp=32800.87Hz
the series resistance is rs=9625 ohms
the parallel capacitance is cp=1.377pF (cp is measured at a frequency far from the resonances)
π=3.14159265359
We can calculate the motional capacitance cm=cp*(fp*fp – fs*fs)/(fs*fs) =
3.09582166*10^-15 farad
We can calculate the motional inductance Lm=1/(cp*4*π*π*(fp*fp – fs*fs) )=7.62199929*10^3 henry
The quality factor Q=Lm*2*π*fs/rs
Q=163022
With the help of the LTspice simulator, we can find the value of the capacitor that we must put in series with the quartz crystal to displace the series resonance at the exact frequency of 32768Hz.
C=11.2pF
Note : when we did these measurements, the 20MHz clock of the network analyzer was not calibrated, then these measurements are only useful to illustrate the calculation.
 Impedance at the input of a coax cable, the output is open.
(The scale for the impedance is log, the scale for the phase is linear) The length of the cable is 3.07m, the position of the maximuns and the minimuns is an indication of the length of the cable.
This measurement can help to find the position of a defect on a cable.
The frequency of the first minimun is inversely proportional to the length of the cable.
Impedance at the input of a coax cable, the output is loaded with a resistor.
The value of the resistor is equal to the characteristic impedance of the cable.
It is the same cable as previously, but now the scale of the impedances is linear, and the output of the cable is loaded by two 100Ω resistors,( put in parallels to get 50Ω).
The two resistors are surface mounted resistors, the case is 1206; they are assembled at 180 degrees one compared to the other. The length of connections is very short.
To determine the characteristic impedance of a cable, we have to find the value of the resistor that it is necessary to put at an end of the cable, so that at the other end, the impedance varies the least possible with the frequency. Another method consists in using a generator of square signal and an oscilloscope.
 A 10MHz band pass filter measurement.
The vertical scale is 20dB/division. The system of detection used by this network analyzer is sensitive to the harmonics. On this type of curve, it has been necessary to choose 16 points of measurements per cycle (to reject the odd harmonics) . See the description of the analyzer for more explanation.
This filter consists of 3 parallel resonators (L=150nH, C=1500pF), coupled by capacitors (150pF), the coupling capacitors at each end have a value of 300pF.
To measure the first part of the curve, the scanning rate was very slow, in order to have the greatest dynamics.
 Capacitors measurements
It is a comparison between a NPO/COG capacitor and a polyester capacitor.
The capacitance of the two capacitors is close to 1000pF.
In dark yellow and dark green , it is the capacitor with the COG/NPO dielectric (smd capacitor, case 1206). The capacitance remains constant up to 20MHz, the quality factor Q, is very high (up to more than 10000), the frequency of resonance is greater than 150MHz.
In light yellow and light green, it is the polyester capacitor (it is a through hole component, the length of the legs is 4mm ). The capacitance is not constant, it decreases with the frequency. The quality factor is 10 times or 100 times lower than the quality factor of the COG /NPO capacitor. (In addition, the capacitance of the polyester capacitor varies much more with the temperature than the capacitance of the COG capacitor).
To be able to measure the quality factor of the COG/NPO capacitor (whose value is several thousands), it is necessary to be able to measure a variation of phase of a few thousandths of degrees (compared to 90 degrees), whereas the impedance is several KΩ. The impedance increasing when the frequency decreases, the noise on the measure of Q increases when the frequency decreases.
When the measurement is finished, you can change the scales and the display formats.
The measurement can be saved as a picture (a .bmp file, 1024*768)
Or the measurement datas can be saved in a file with the extension .s1p (for a one port device), or .s2p (for a two ports device). This file can be read by a s-parameter simulation software (as Qucs, RFSIM99 for example).
To use s1p or s2p files with LTspice : http://tech.groups.yahoo.com/group/LTspice/files/%20Tut/S-Parameter/S-Parameter%20to%20SPICE/
The description of the analyzer, the electrical schematics, and some indications to use the programs : ana_anglais_150mhz_3.pdf
The programs for windows: network_analyzer_windows_3.zip
The programs for linux (UBUNTU) : network_analyzer_linux-2.zip
The programs for the ATmega168 : arduino_anareso_150_v01-2.zip
The printed circuits as pdf files : copper_anareso_150_mirror.zip
Somes photographs of the boards: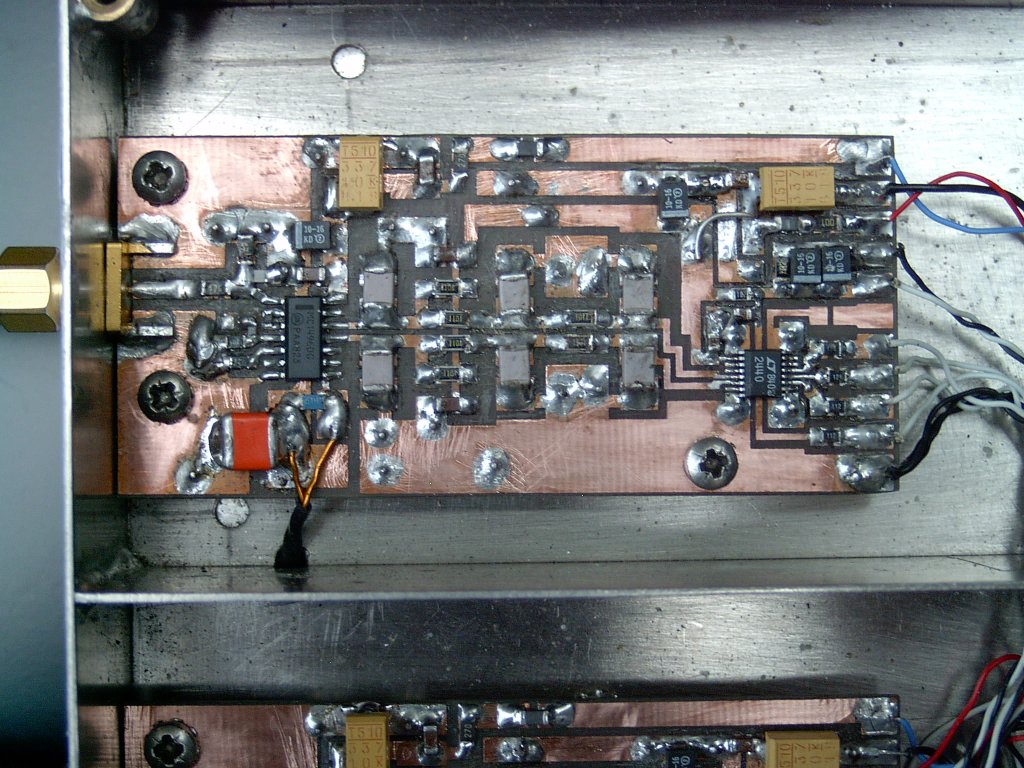
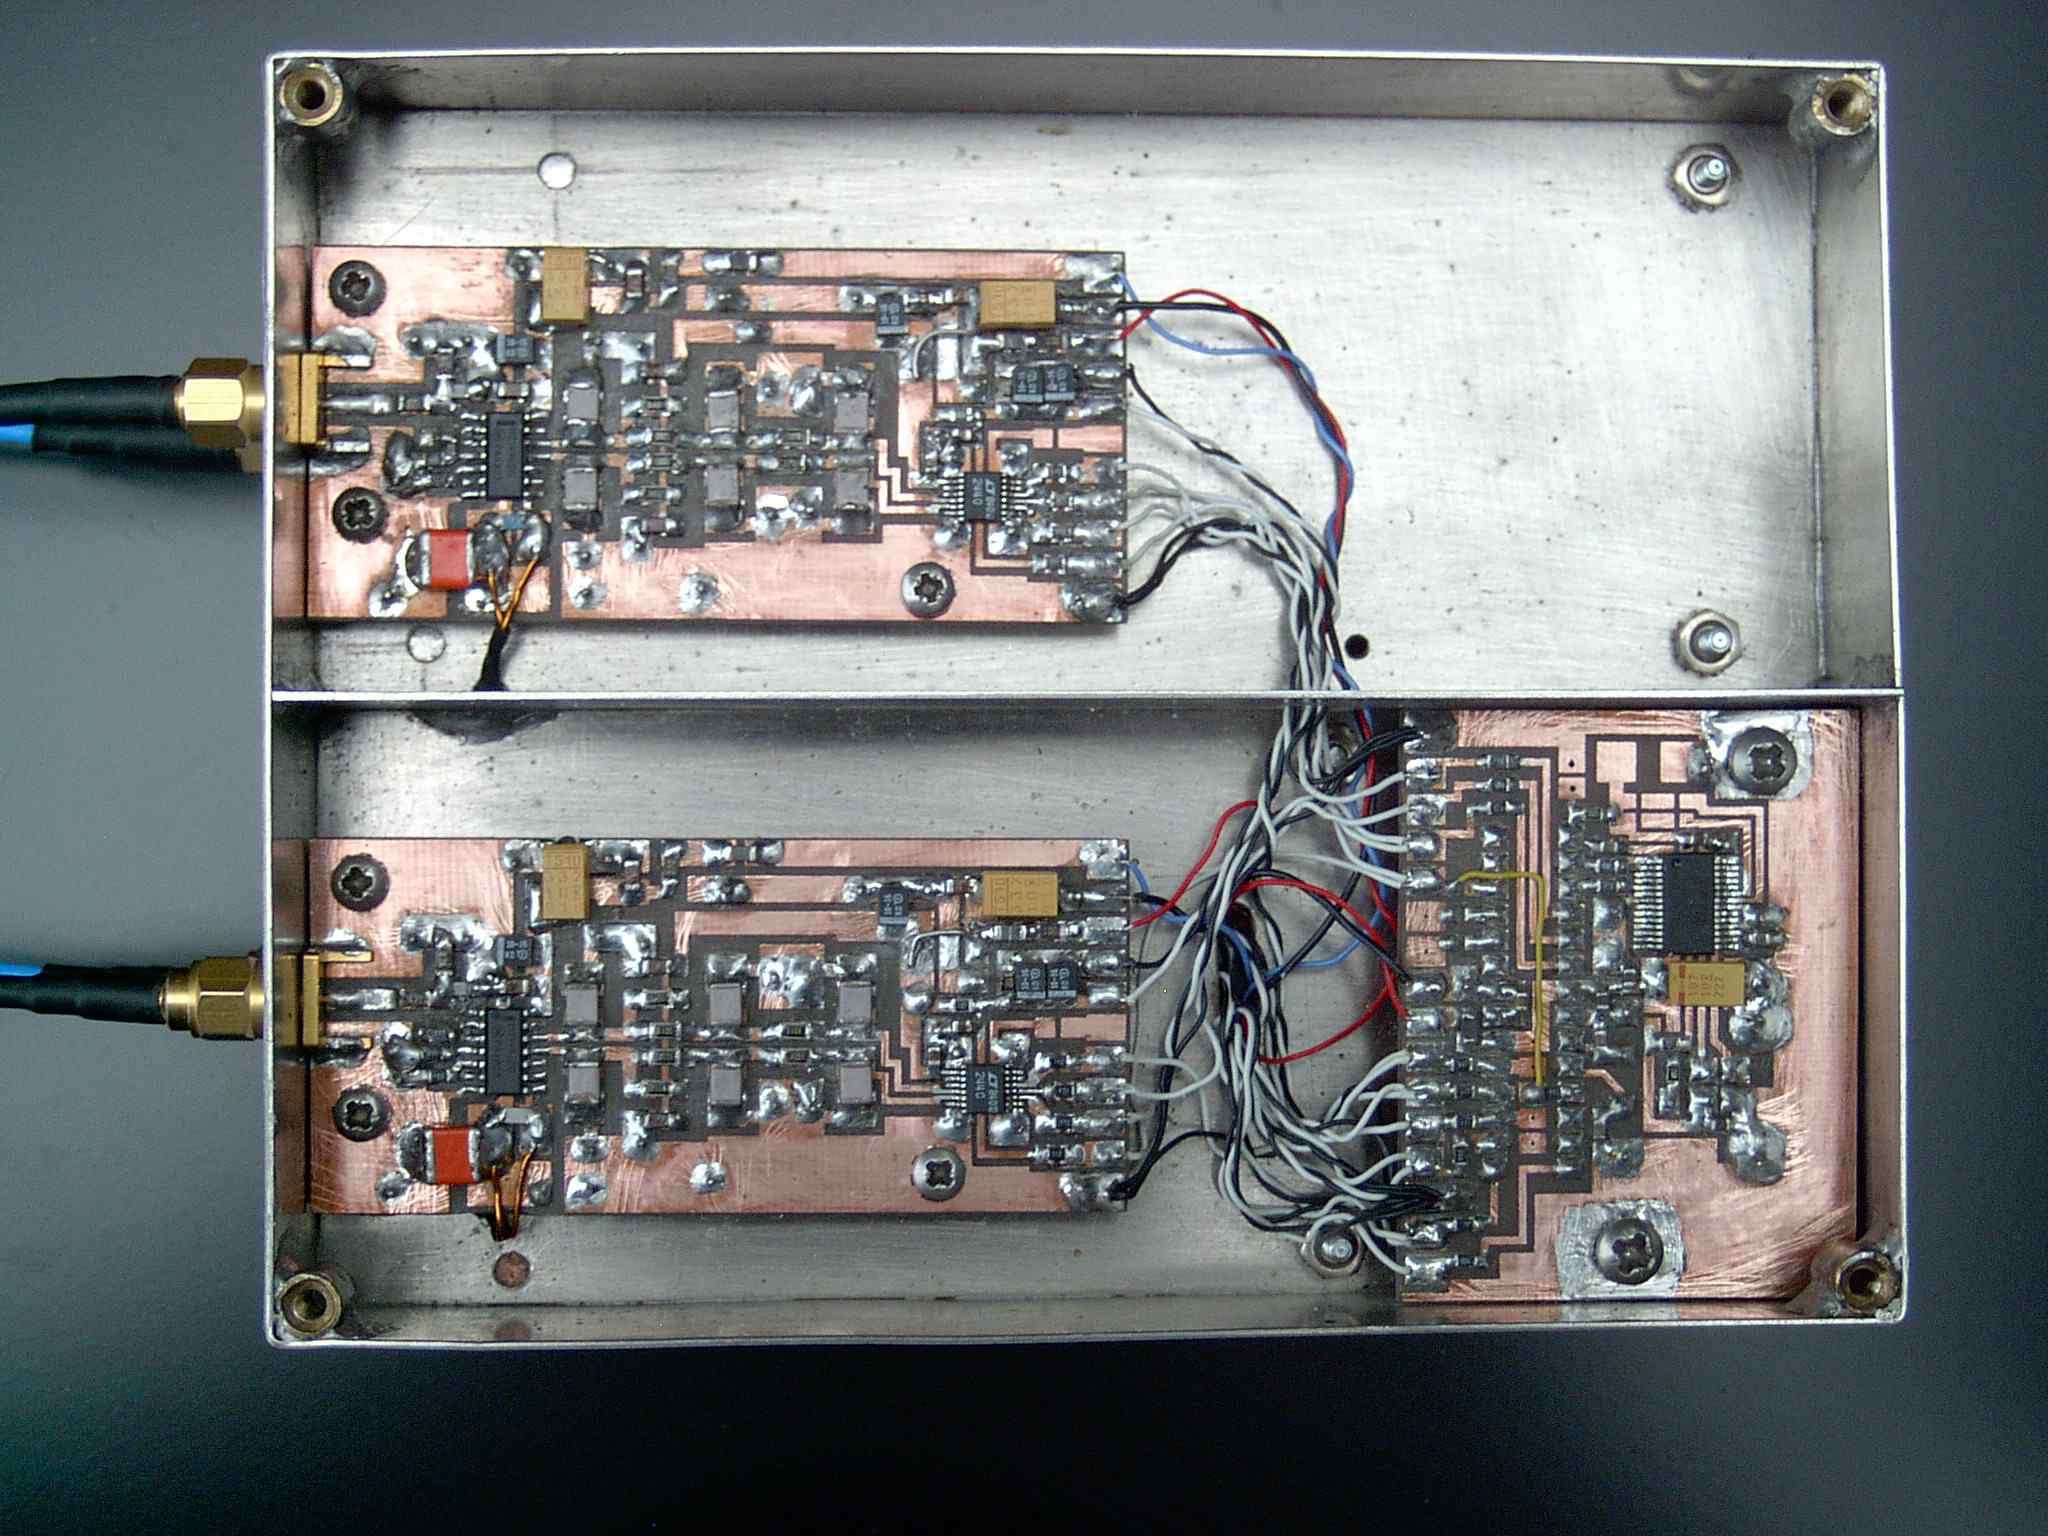
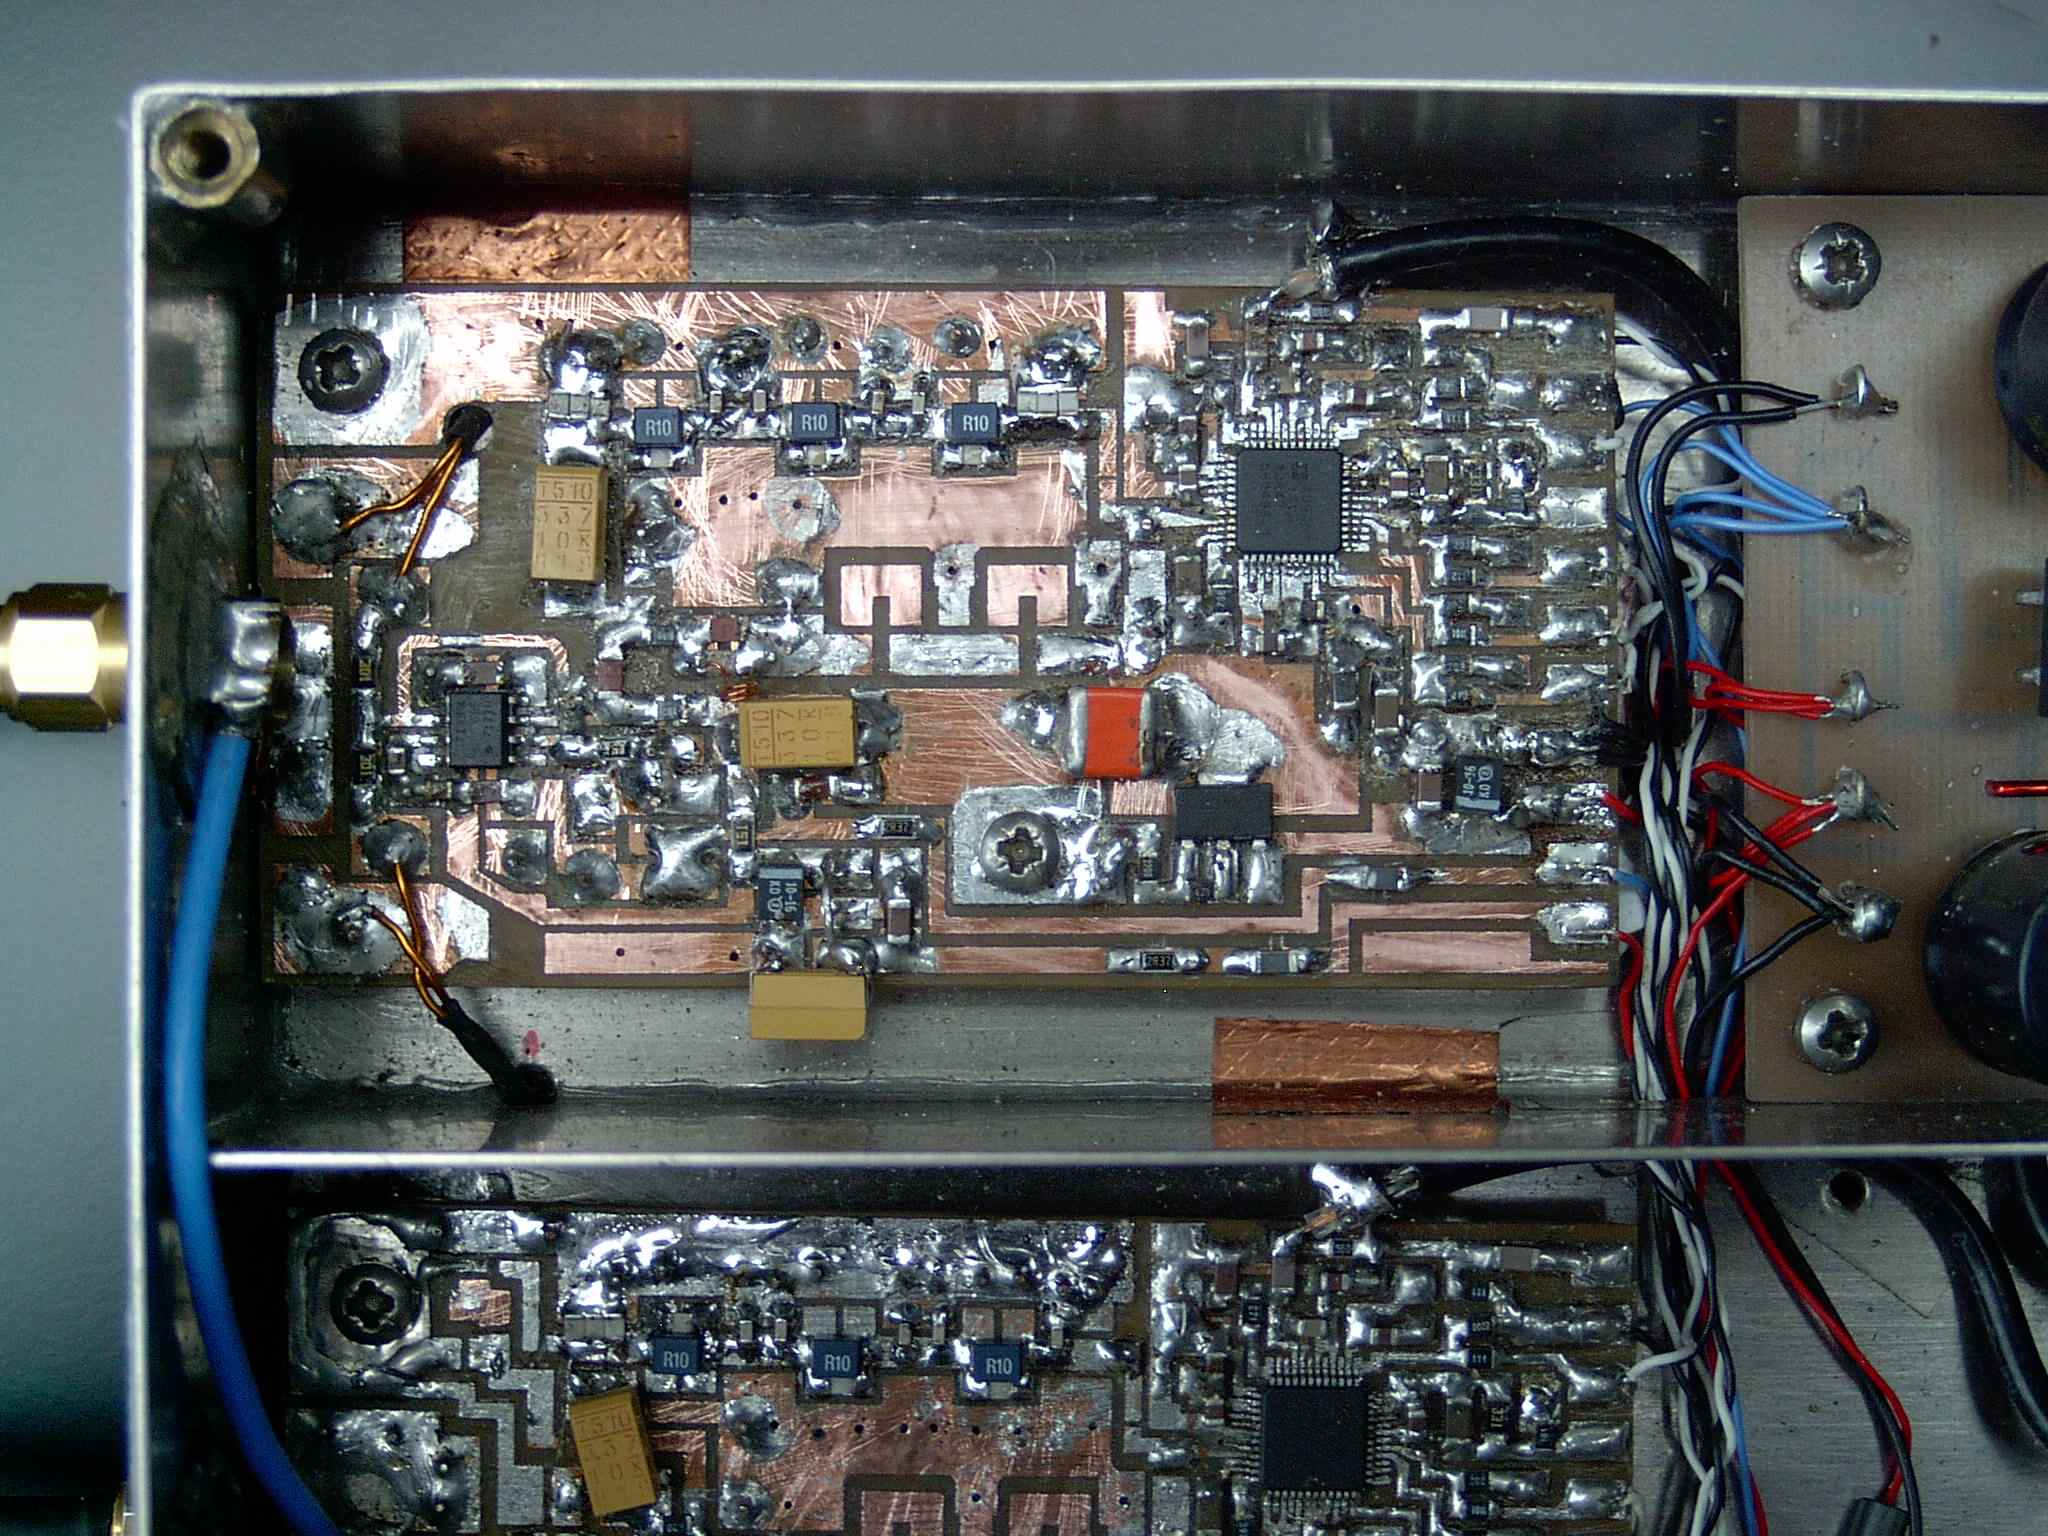
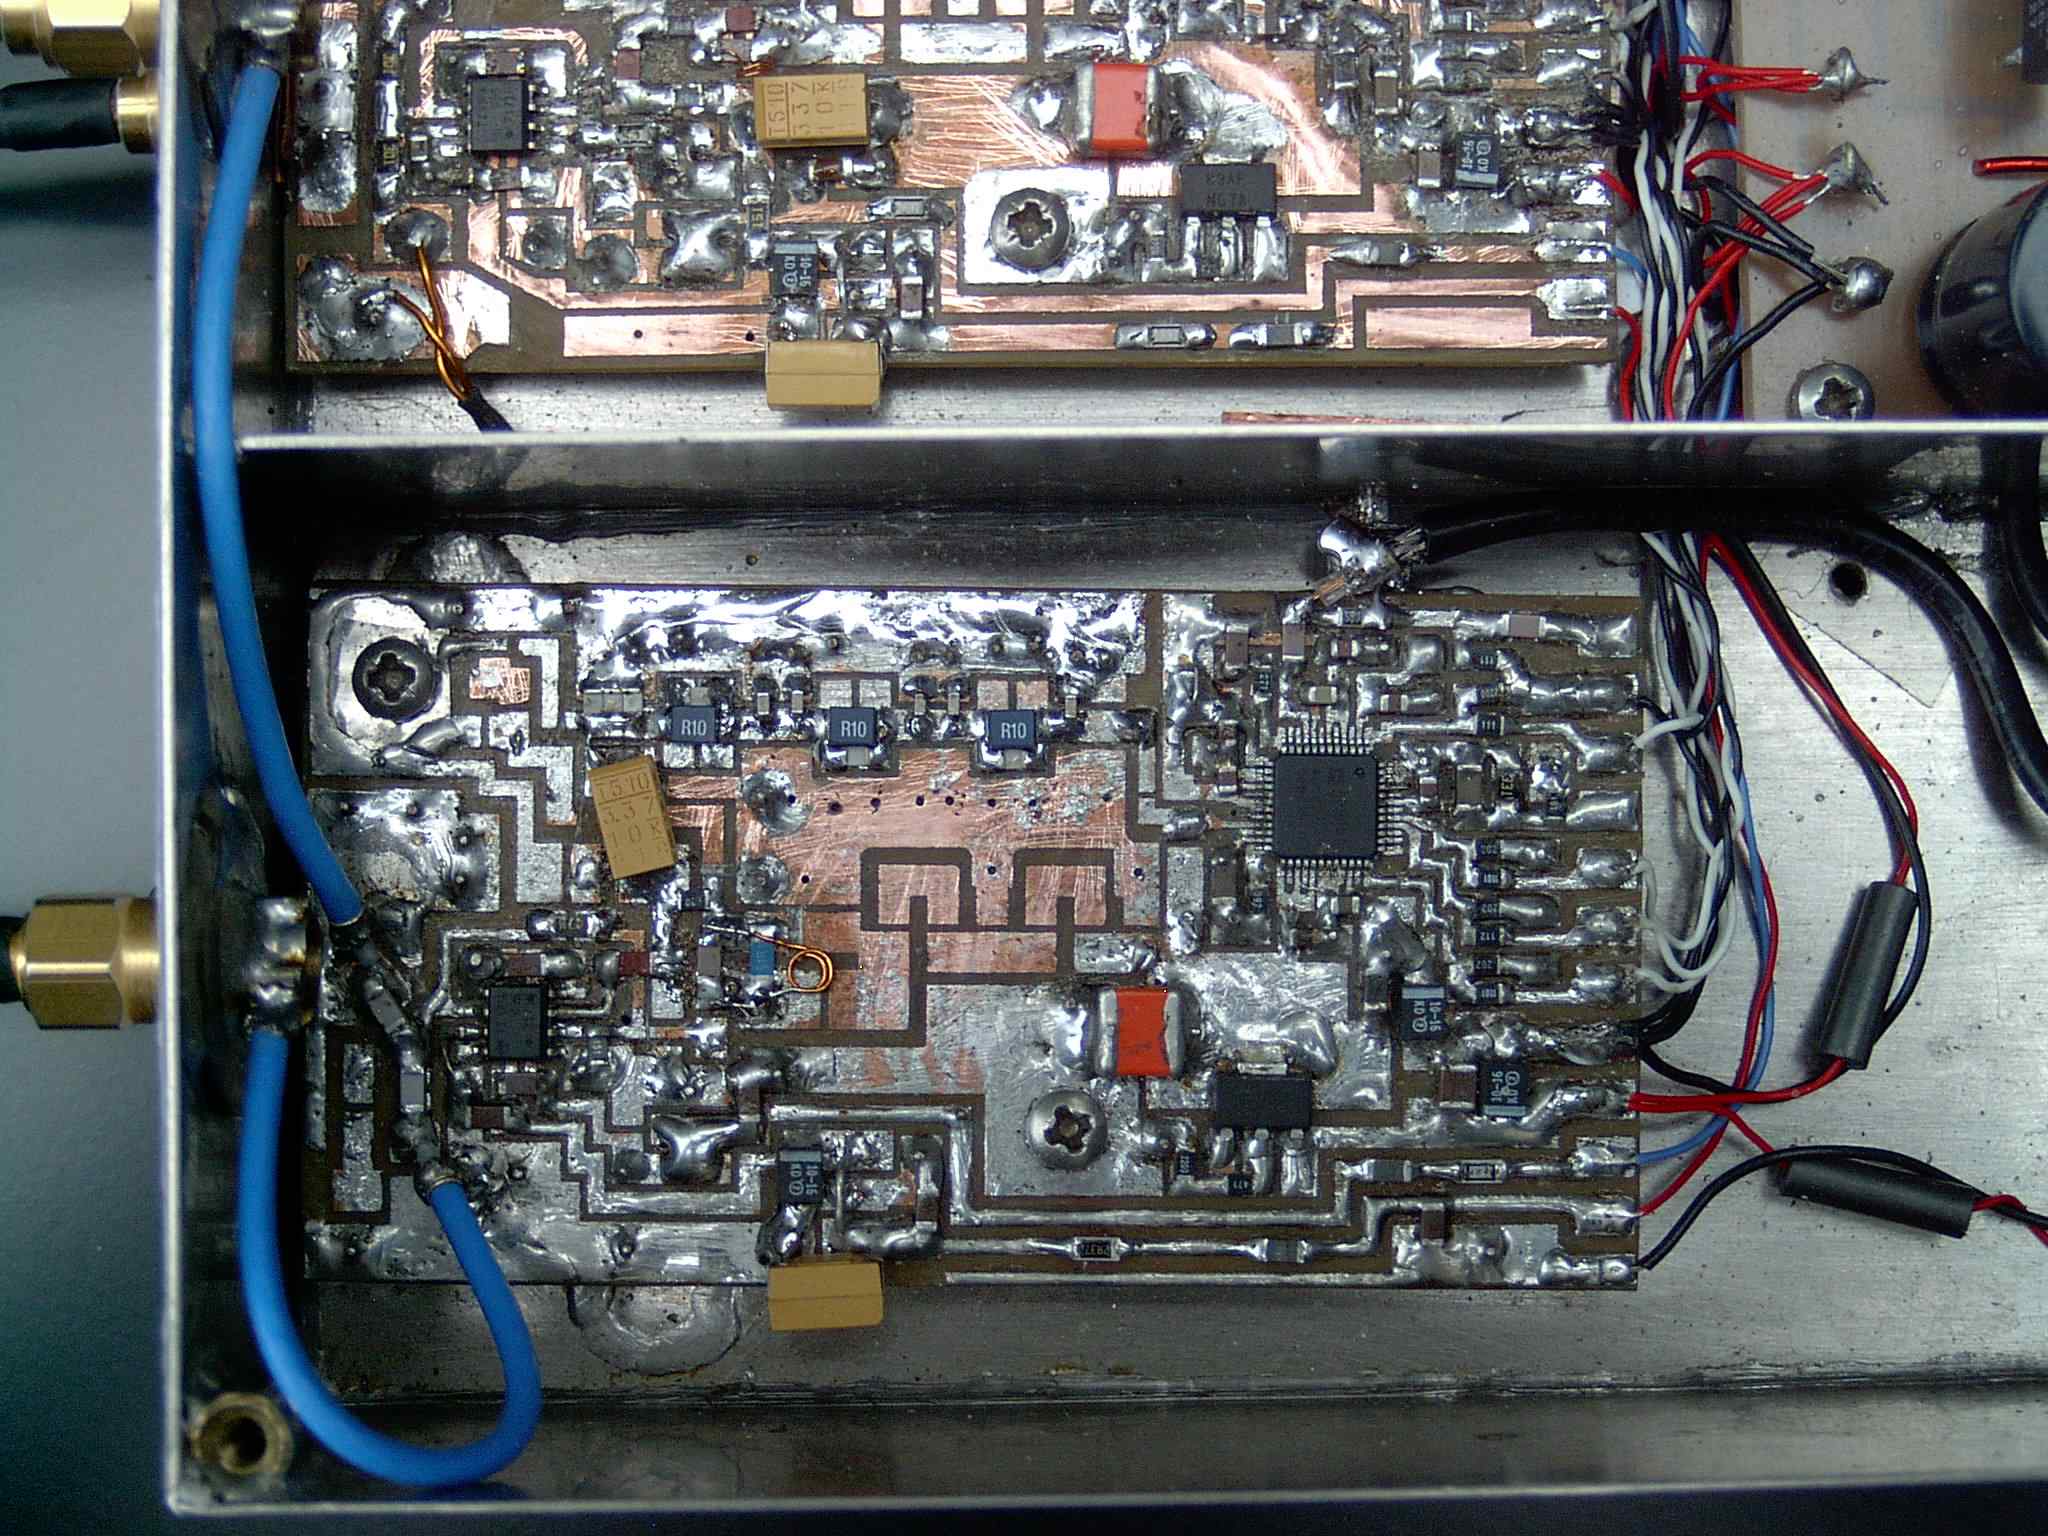
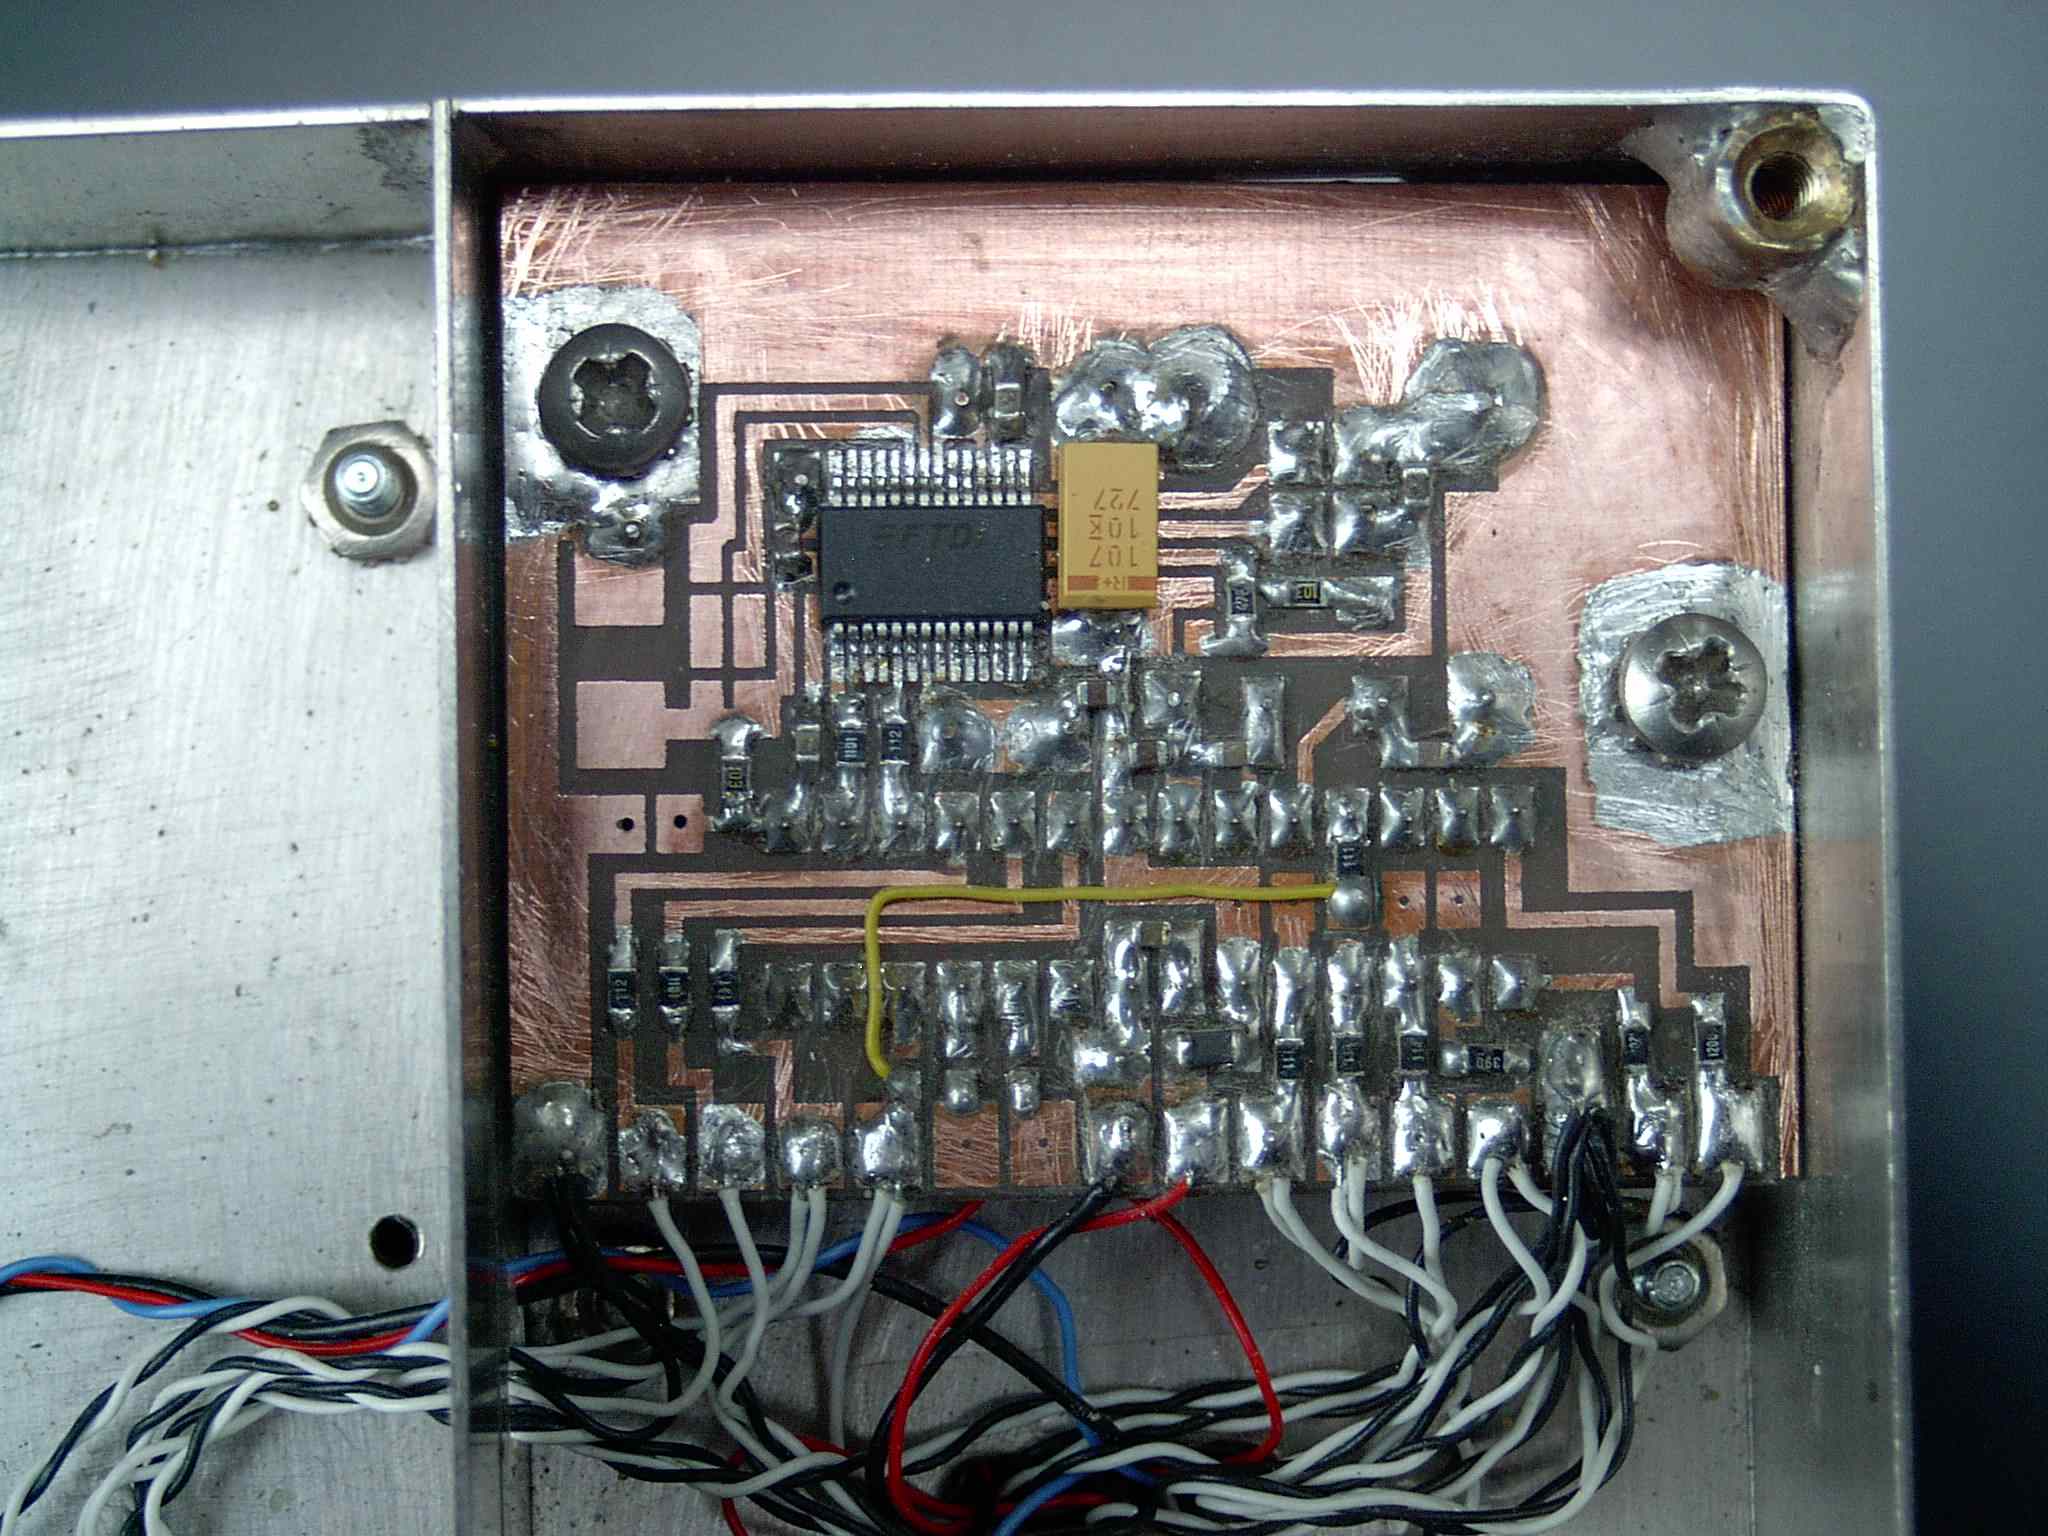
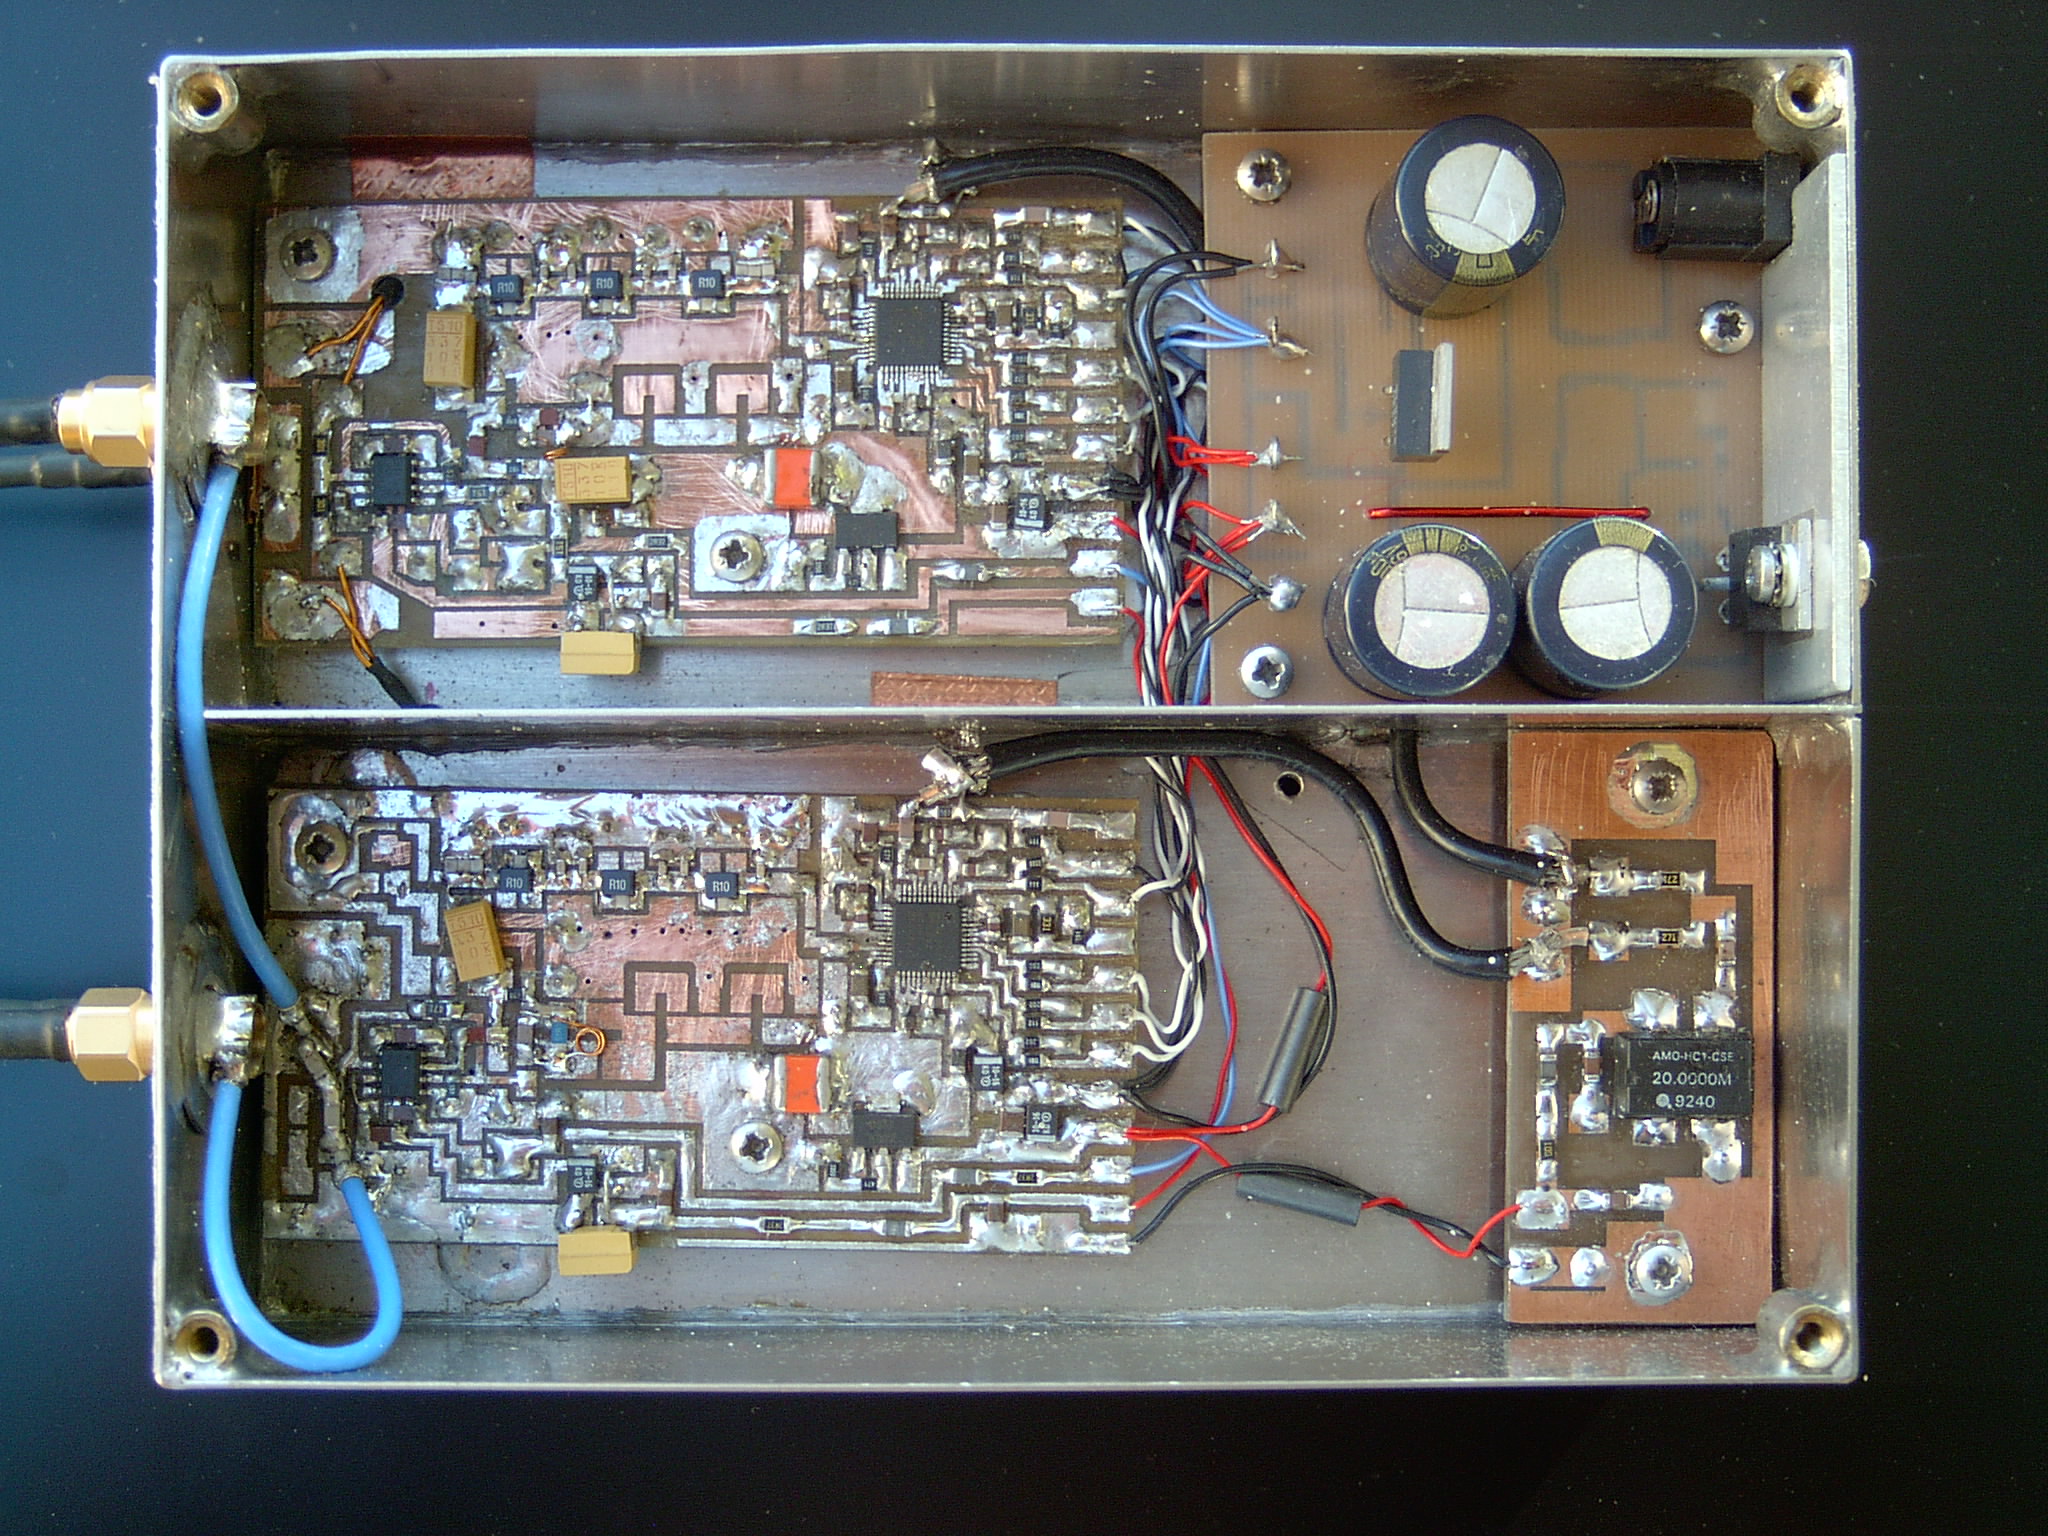
On the photographs, some components of the generators boards (DDS1 & DDS2) are not visible. These components are placed on the ground plane side (transistors BFR520 and several 330uF capacitors); a lot of modifications have been necessary to realize the analyzer.
A new layout of the components on the printed circuits boards has been studied (but the printed ciruits boards are not yet realized).
For the moment, we have no other AD9951 (the generator), we hesitate to unsolder the AD9951 of our prototype to resolder them on the new study (we are afraid of damage during transplantation !).
Measurement accessories : measurement_accessories-2.pdf
Contact: If you have questions, remarks or suggestions, do not hesitate to write at : jacqueslacroix(at)free.fr
(As you can see, my English is a disaster, but I will do my best to answer !)
Some links :
http://www.freebasic.net/ (We wrote the programs with this software).
http://www.arduino.cc/ (an USB interface)
http://www.lancos.com/prog.html (PonyProg software)
http://n2pk.com/ (A network analyzer with a very good documentation.)
http://www.linear.com/designtools/software/switchercad.jsp
(a SPICE simulation software (LTspice), with this software we can simulate some parts of our analyzer.)
http://groups.yahoo.com/group/LTspice (LTspice users group, useful to get the spice model of some components (MC1496))
http://www.memresearch.com/download.htm (to get the freeEM3DS software, the 400MHZ filter is designed with this software)
http://qucs.sourceforge.net/
Qucs, briefly for Quite Universal Circuit Simulator, the software aims to support all kinds of circuit simulation types, e.g. DC, AC, S-parameter, Harmonic Balance analysis, noise analysis, etc.
http://electroschematics.com/835/rfsim99-download/
(RFSim99 is a free S-parameter based circuit simulator)
http://www.hparchive.com/Application_Notes/HP-AN-95-1.pdf (An application note by HP on S-Parametre Techniques)
http://www.wetterlin.org/sam/PortView/PortOverview.htm (PortView is a Windows program for viewing and manipulating one-port and two-port S-parameter data.)